Modified Morris Function
A modified version of test function appeared in Morris’ original article [1] is used as a test function in this module. Instead of 20-dimensional function, the modified version is only 4-dimensional and truncated as follows,
The function accepts inputs \(\underline x\) the component of which are :math: 0 < x_i leq 1.
Morris Screening Results
The function was used to test the implementation of the Morris screening and most precisely that of the two designs of experiment: the trajectory and radial designs Morris Screening Method.
Trajectory sampling design
The trajectory effect is the original design proposed by Morris. The design matrix was generated with:
- number of trajectories (r) equal to 10, 100 and 1000 times the number of parameter (k=4),
- and levels (p) equal to 4, 8, 12 and 20.
Each generated design was used to evaluate the Morris modified function and the associated elementary effects were calculated.
The following figures show the \(\sigma\) vs. \(\mu^*\) plot for the four parameters of the Morris modified function for different sets of r and p values. Each set of (r, p) value was repeated 1000 times and a histogram of the results is presented for each parameter in the figures.
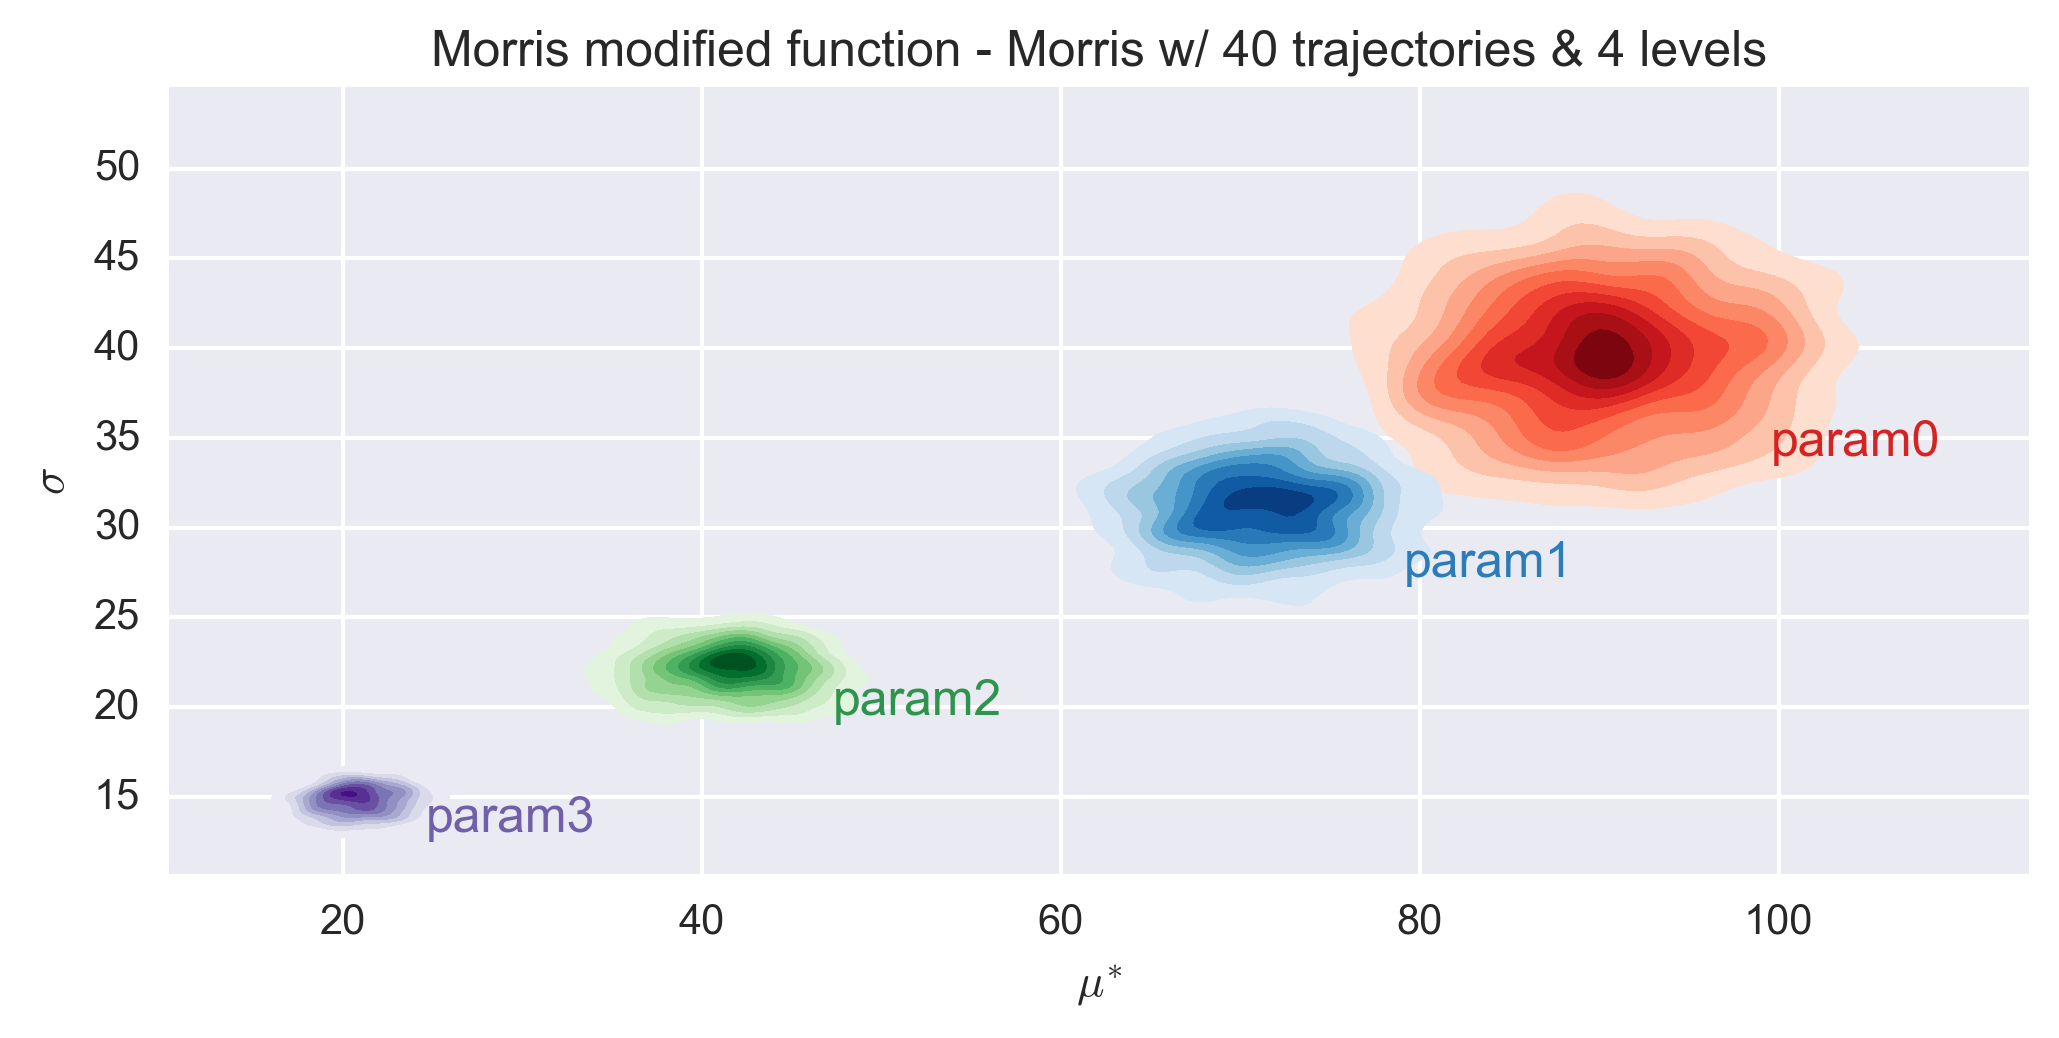
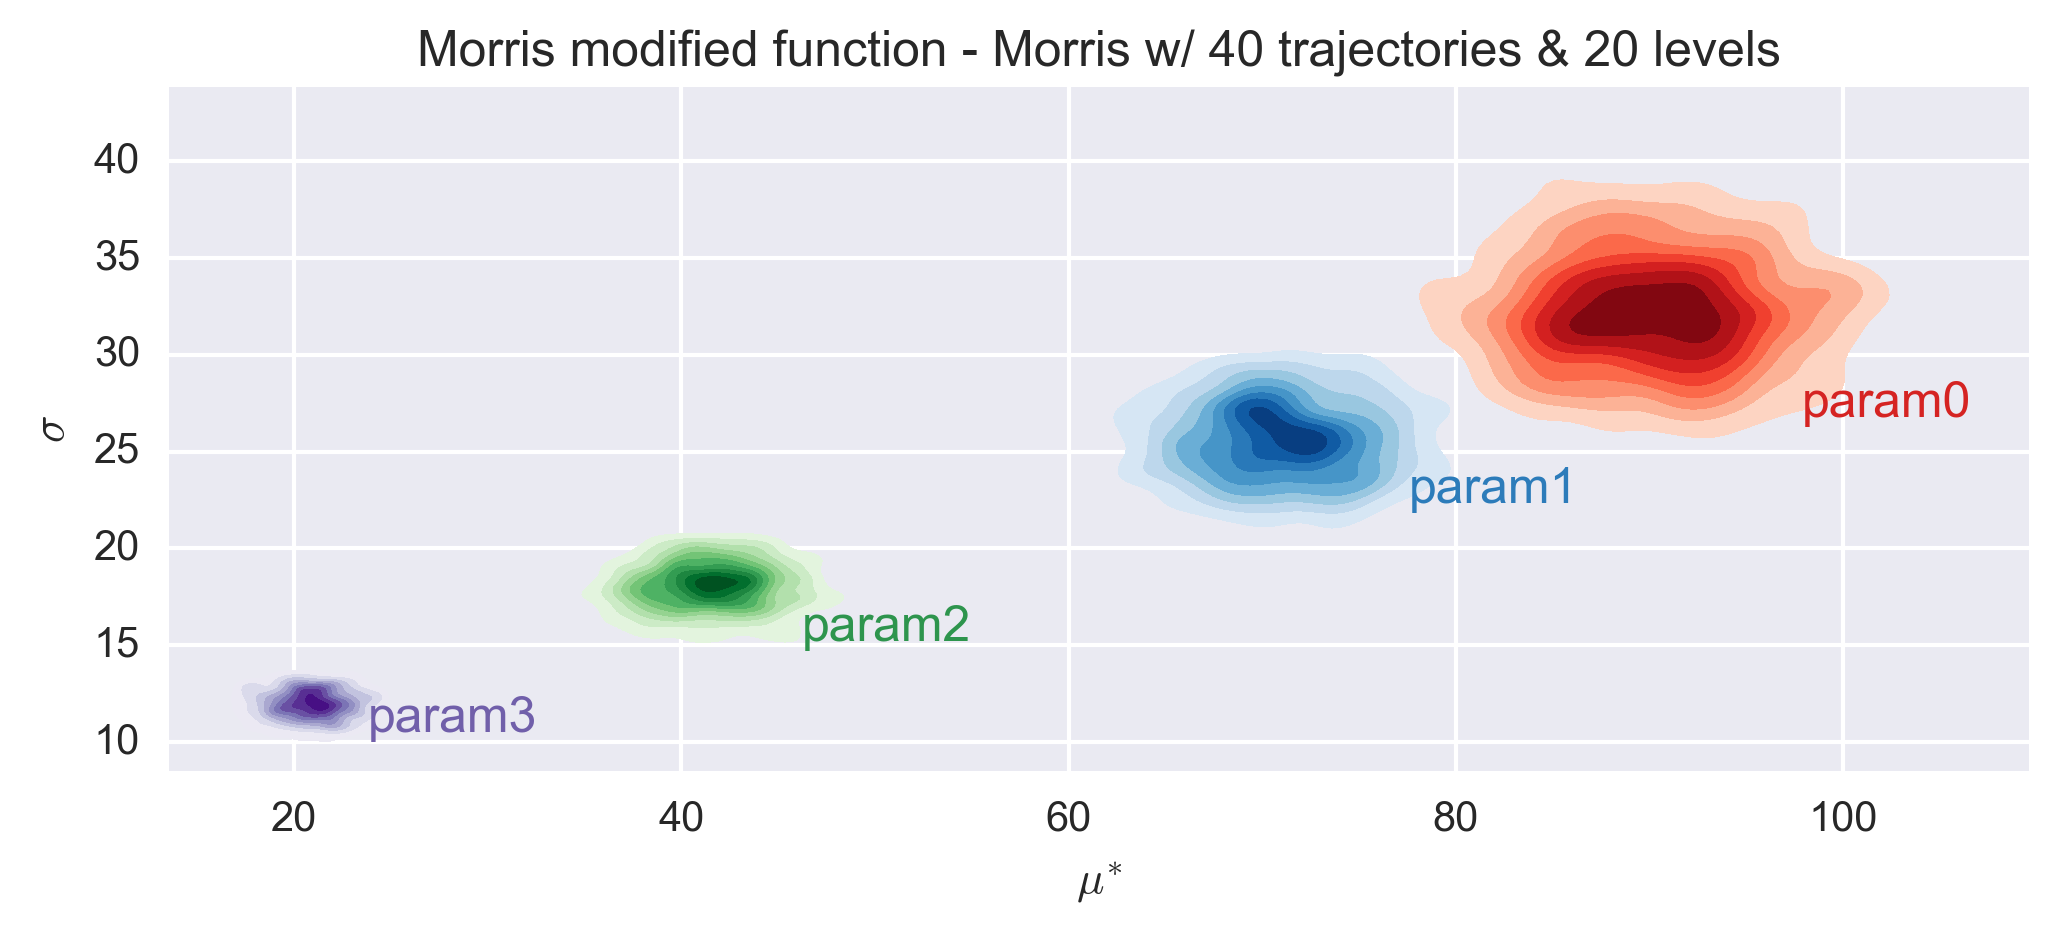
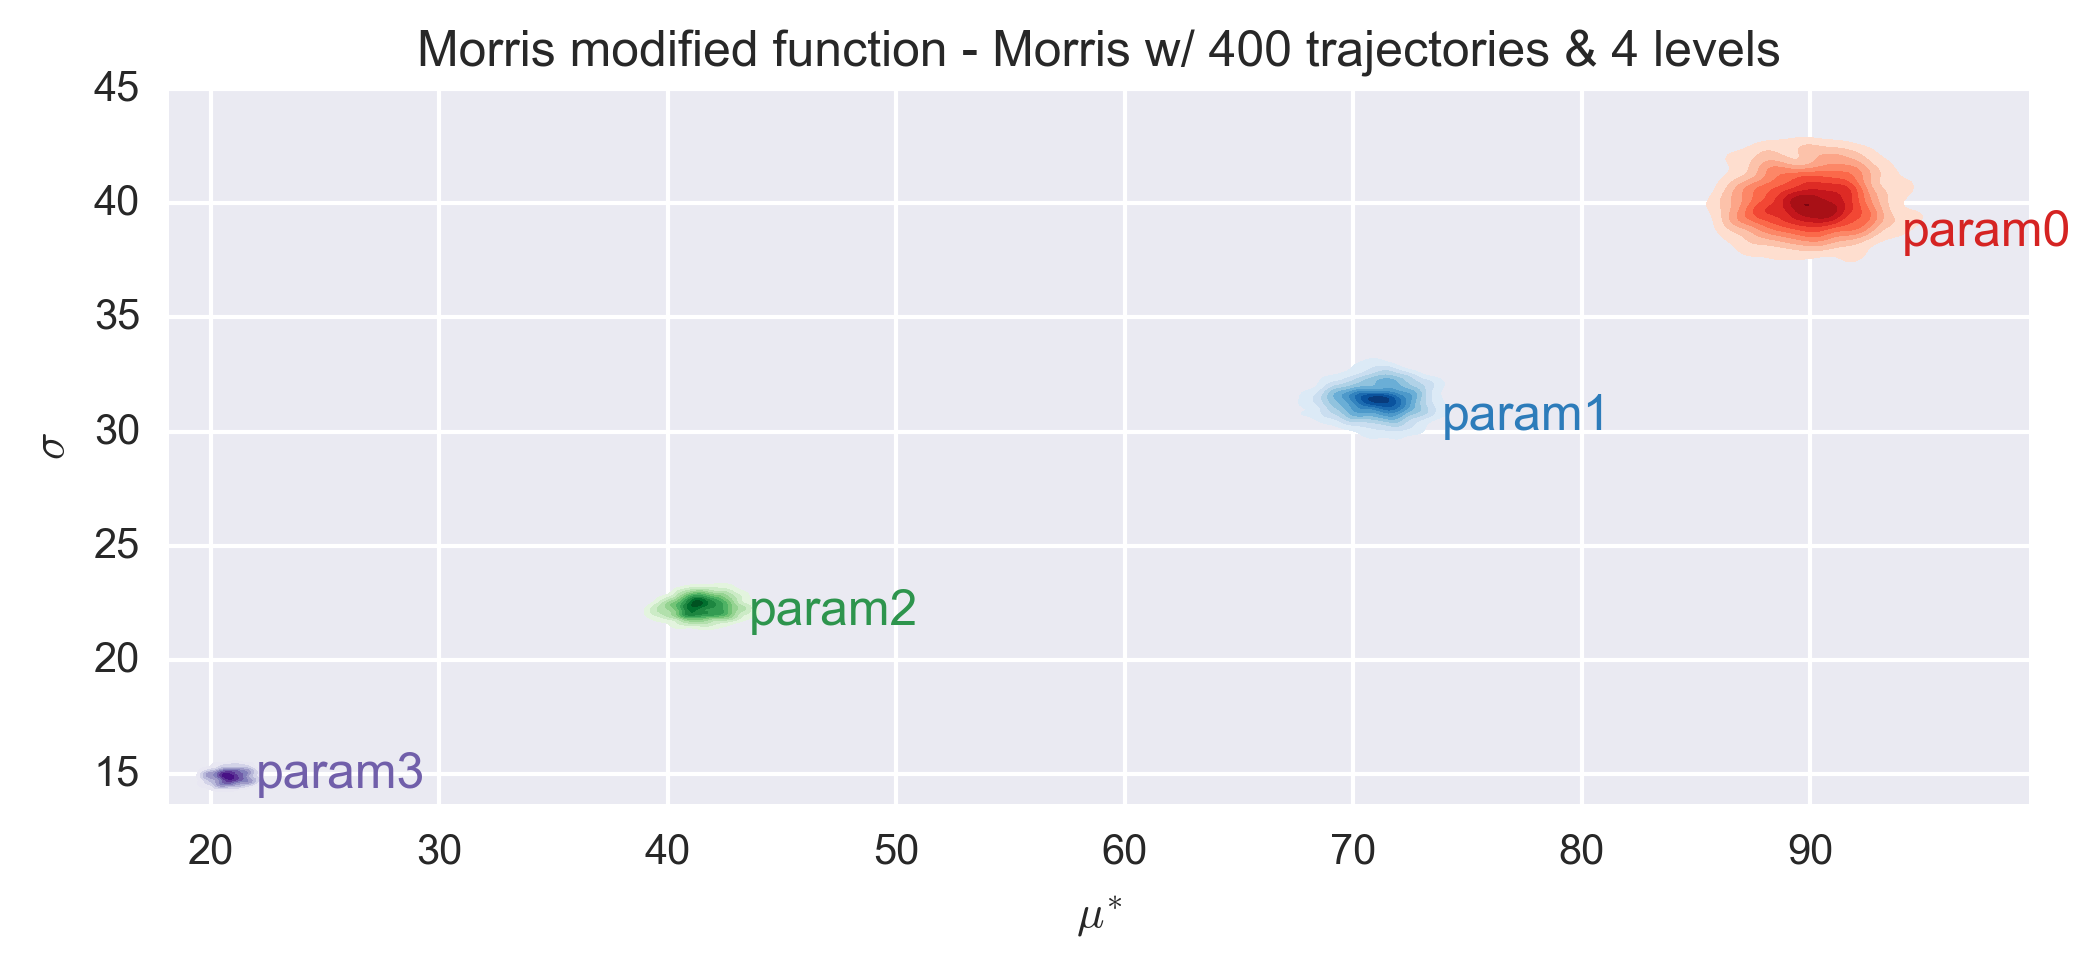
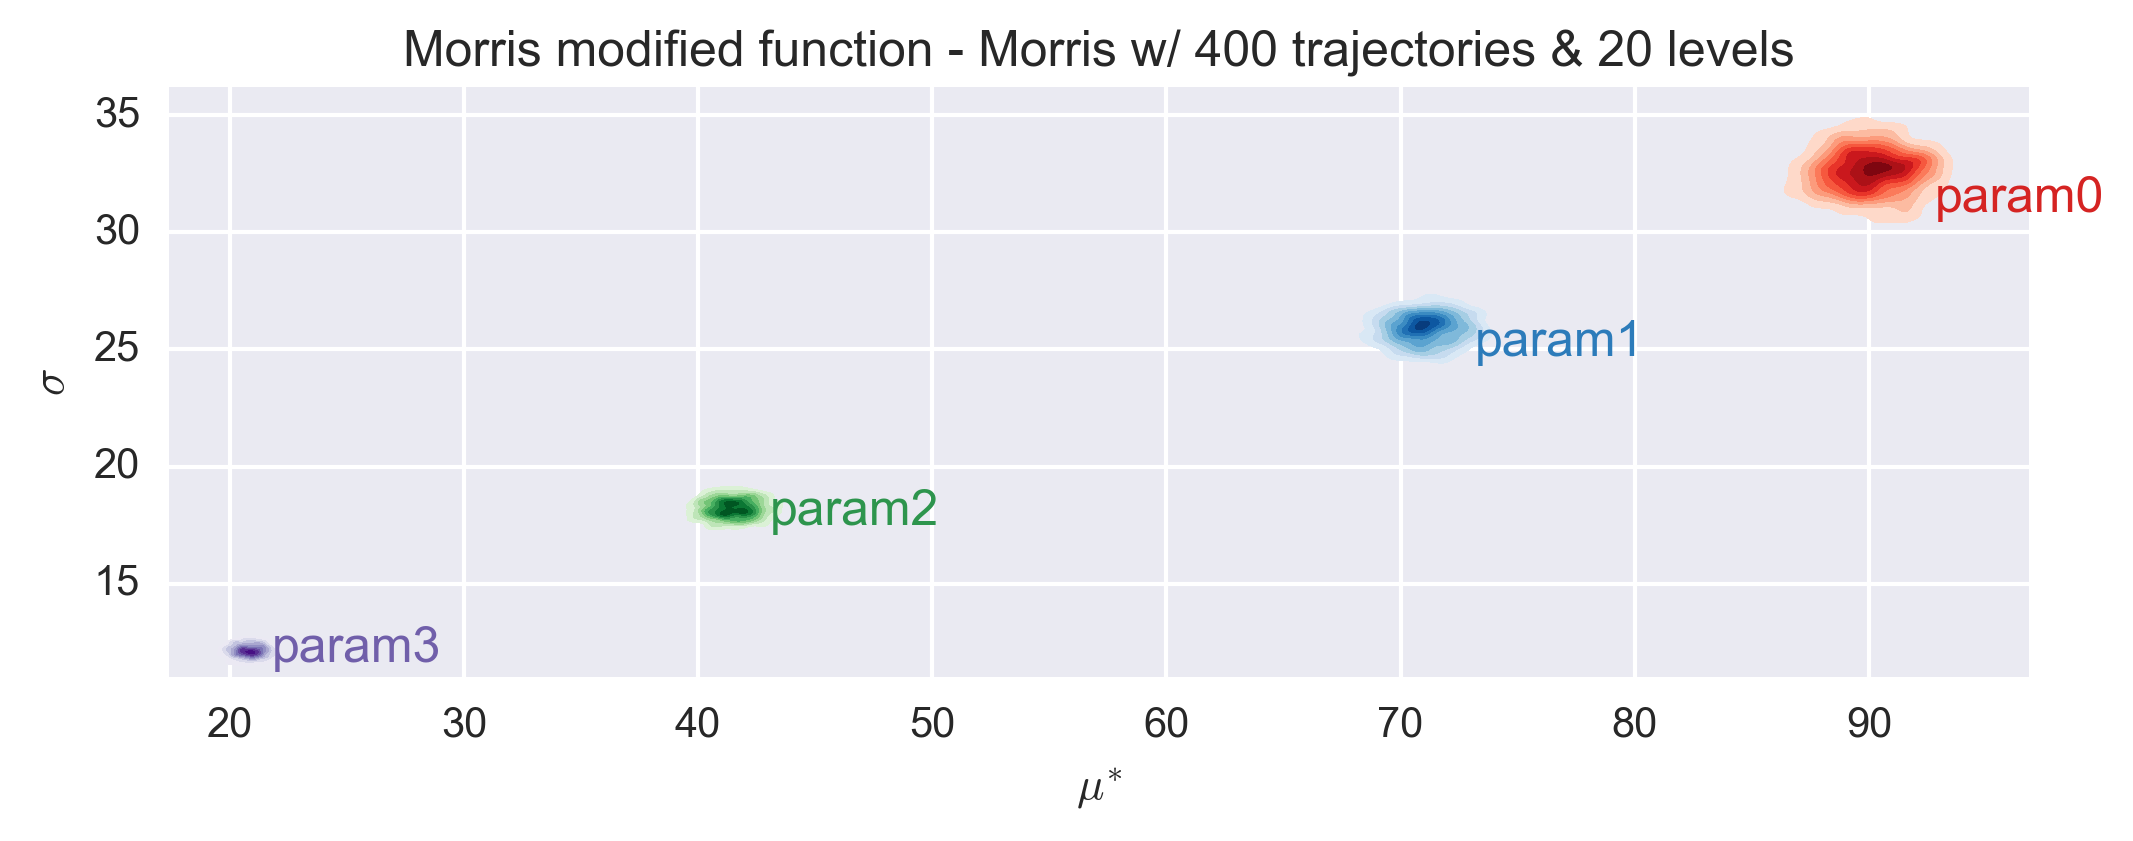
The elementary effects of the function are similar for all combinations of r and p values and consistent with the expected values. As expected, the histogram dispersion is reduced when the number of trajectories increases. The classification of the parameters is stable already for an number of trajectories equals to 10 times the nubmer of dimension.
Radial sampling design
The radial sampling design has been proposed by Campagnolo et al. and is described in more details at Morris Screening Method. Only a number of trajectories, here called blocks to differentiate from the previous design, is required. For testing purposes we investigated, as previously, numbers of blocks (r) equal to 10, 100 and 1000 times the number of parameter (k=4).
Each generated design was used to evaluate the Morris modified function and the associated elementary effects were calculated.
The following figures show the \(\sigma\) vs. \(\mu^*\) plot for the four parameters of the Morris modified function and for the three sets of r values. Countrary to the trajectory design, the radial design uses the Sobol generator, which is deterministic. As such no repetitions were performed to investigate the dispersion of the (\(\sigma\), \(\mu^*\)) values.
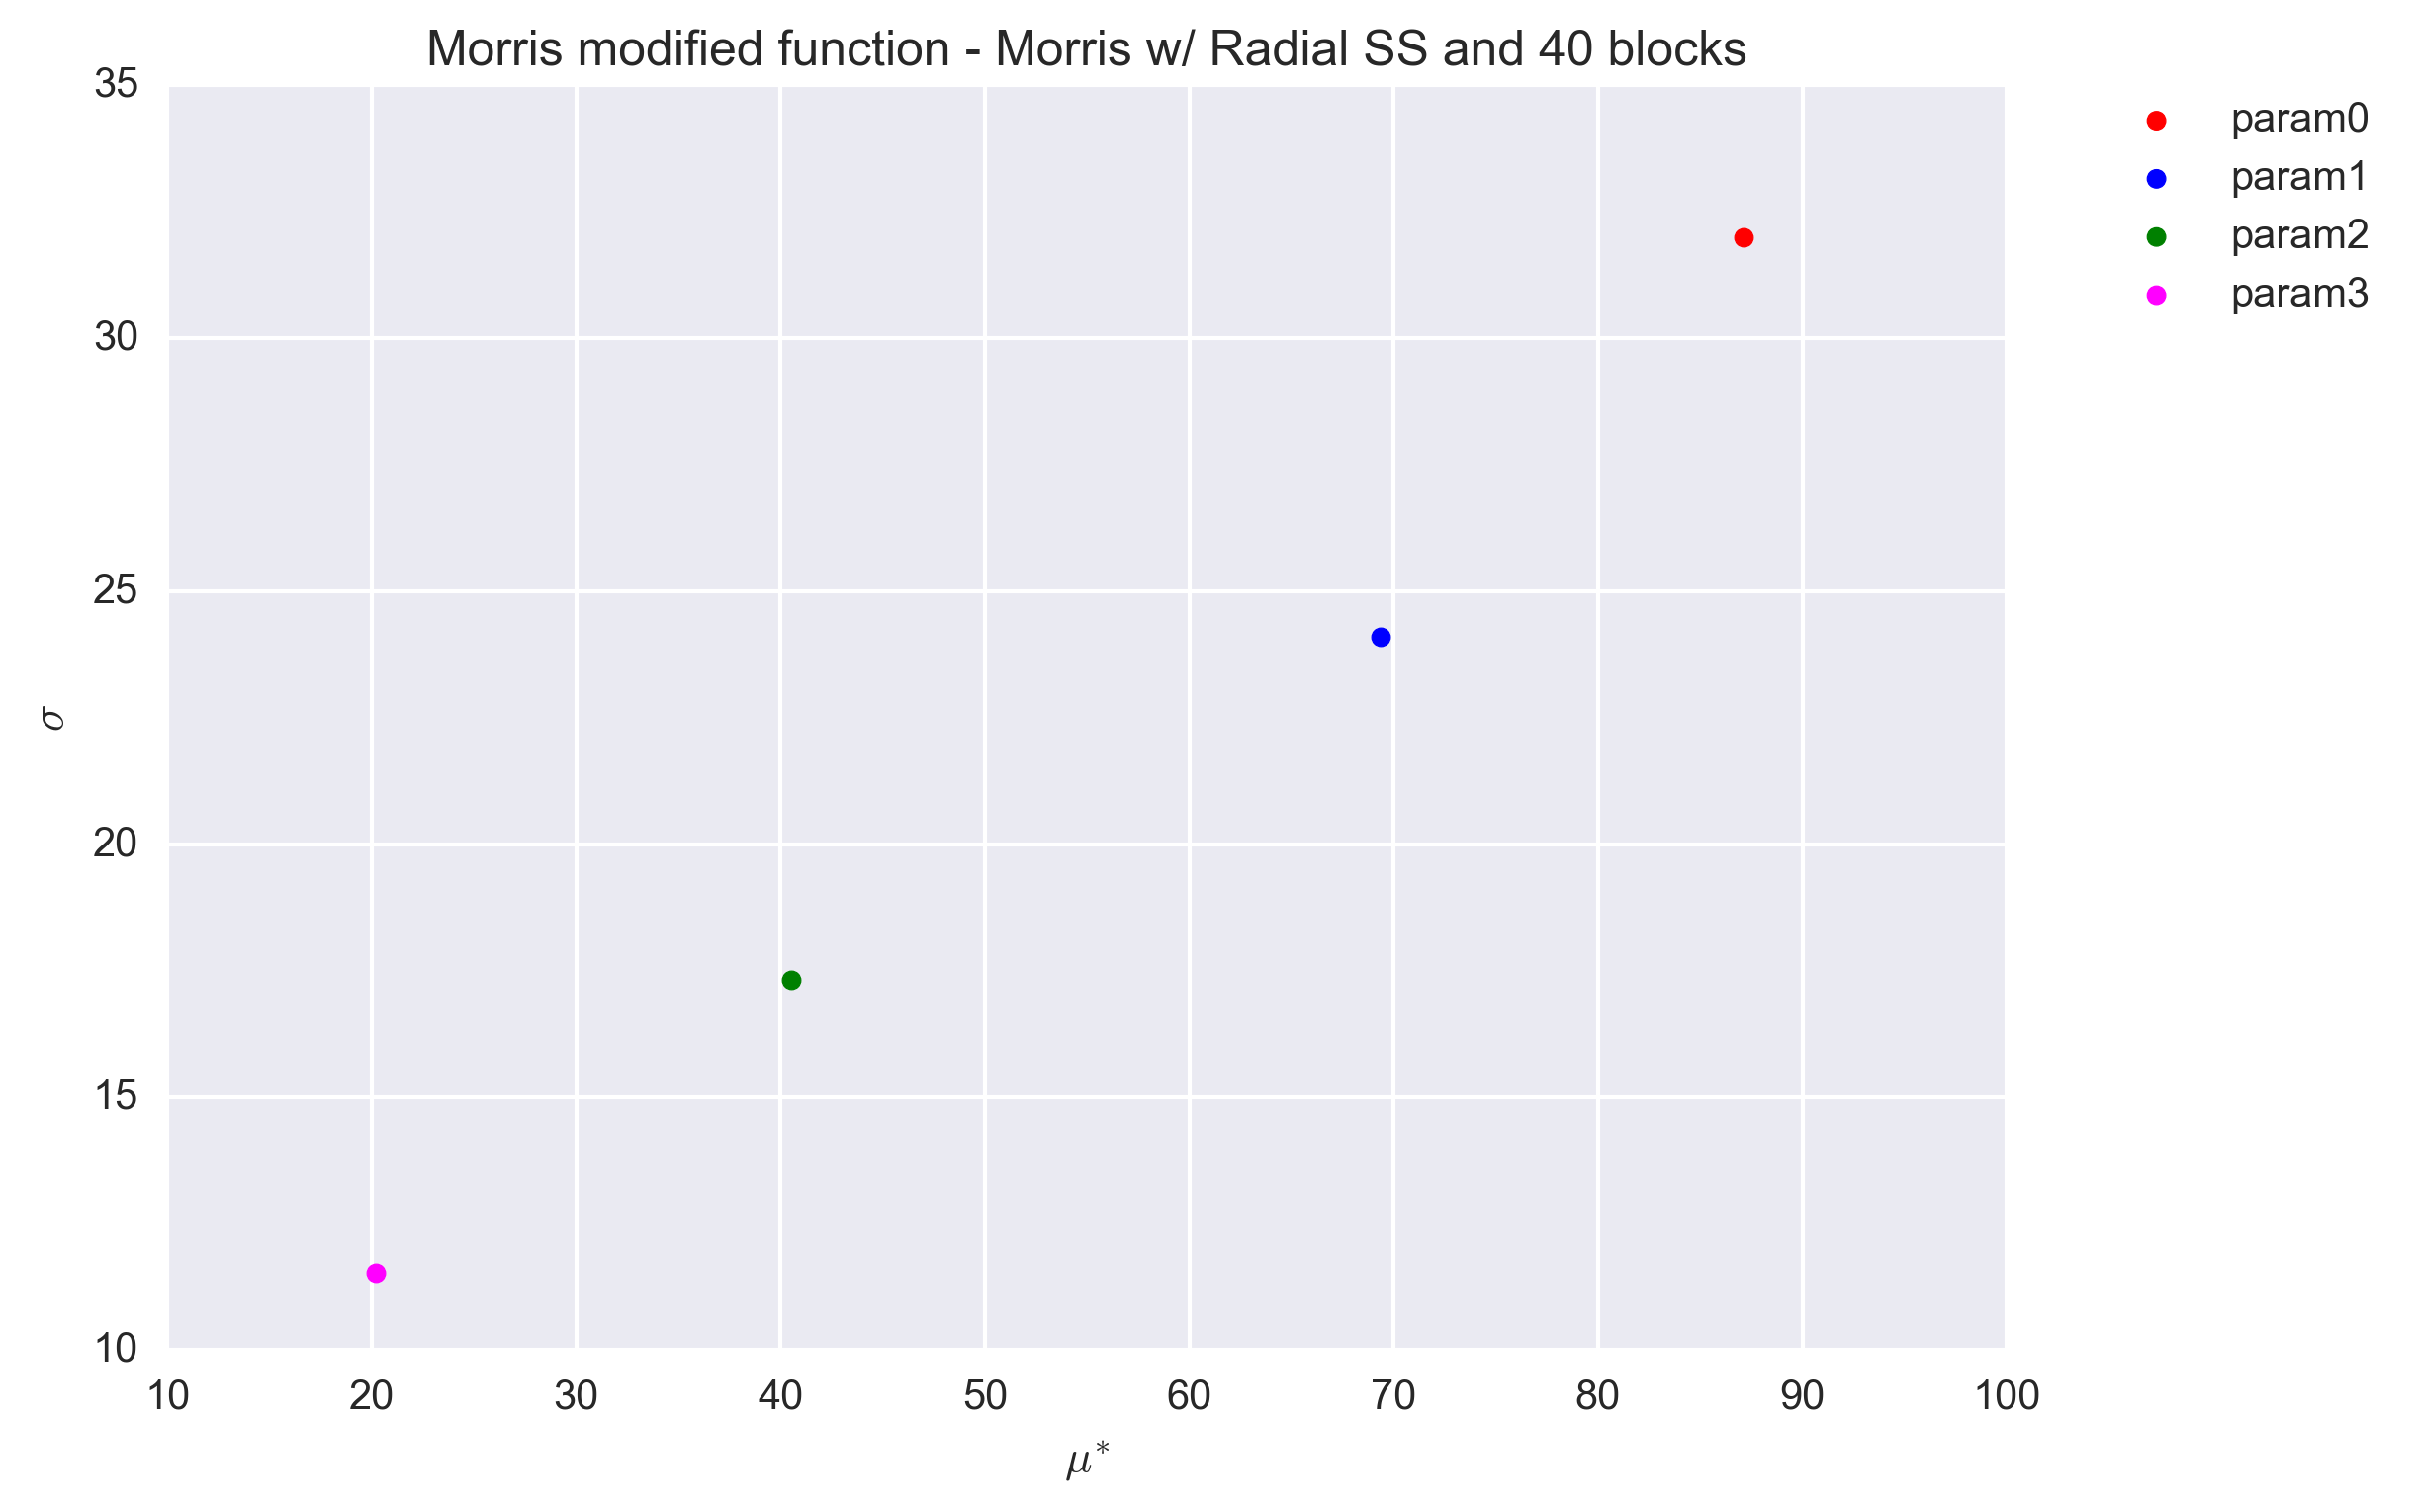
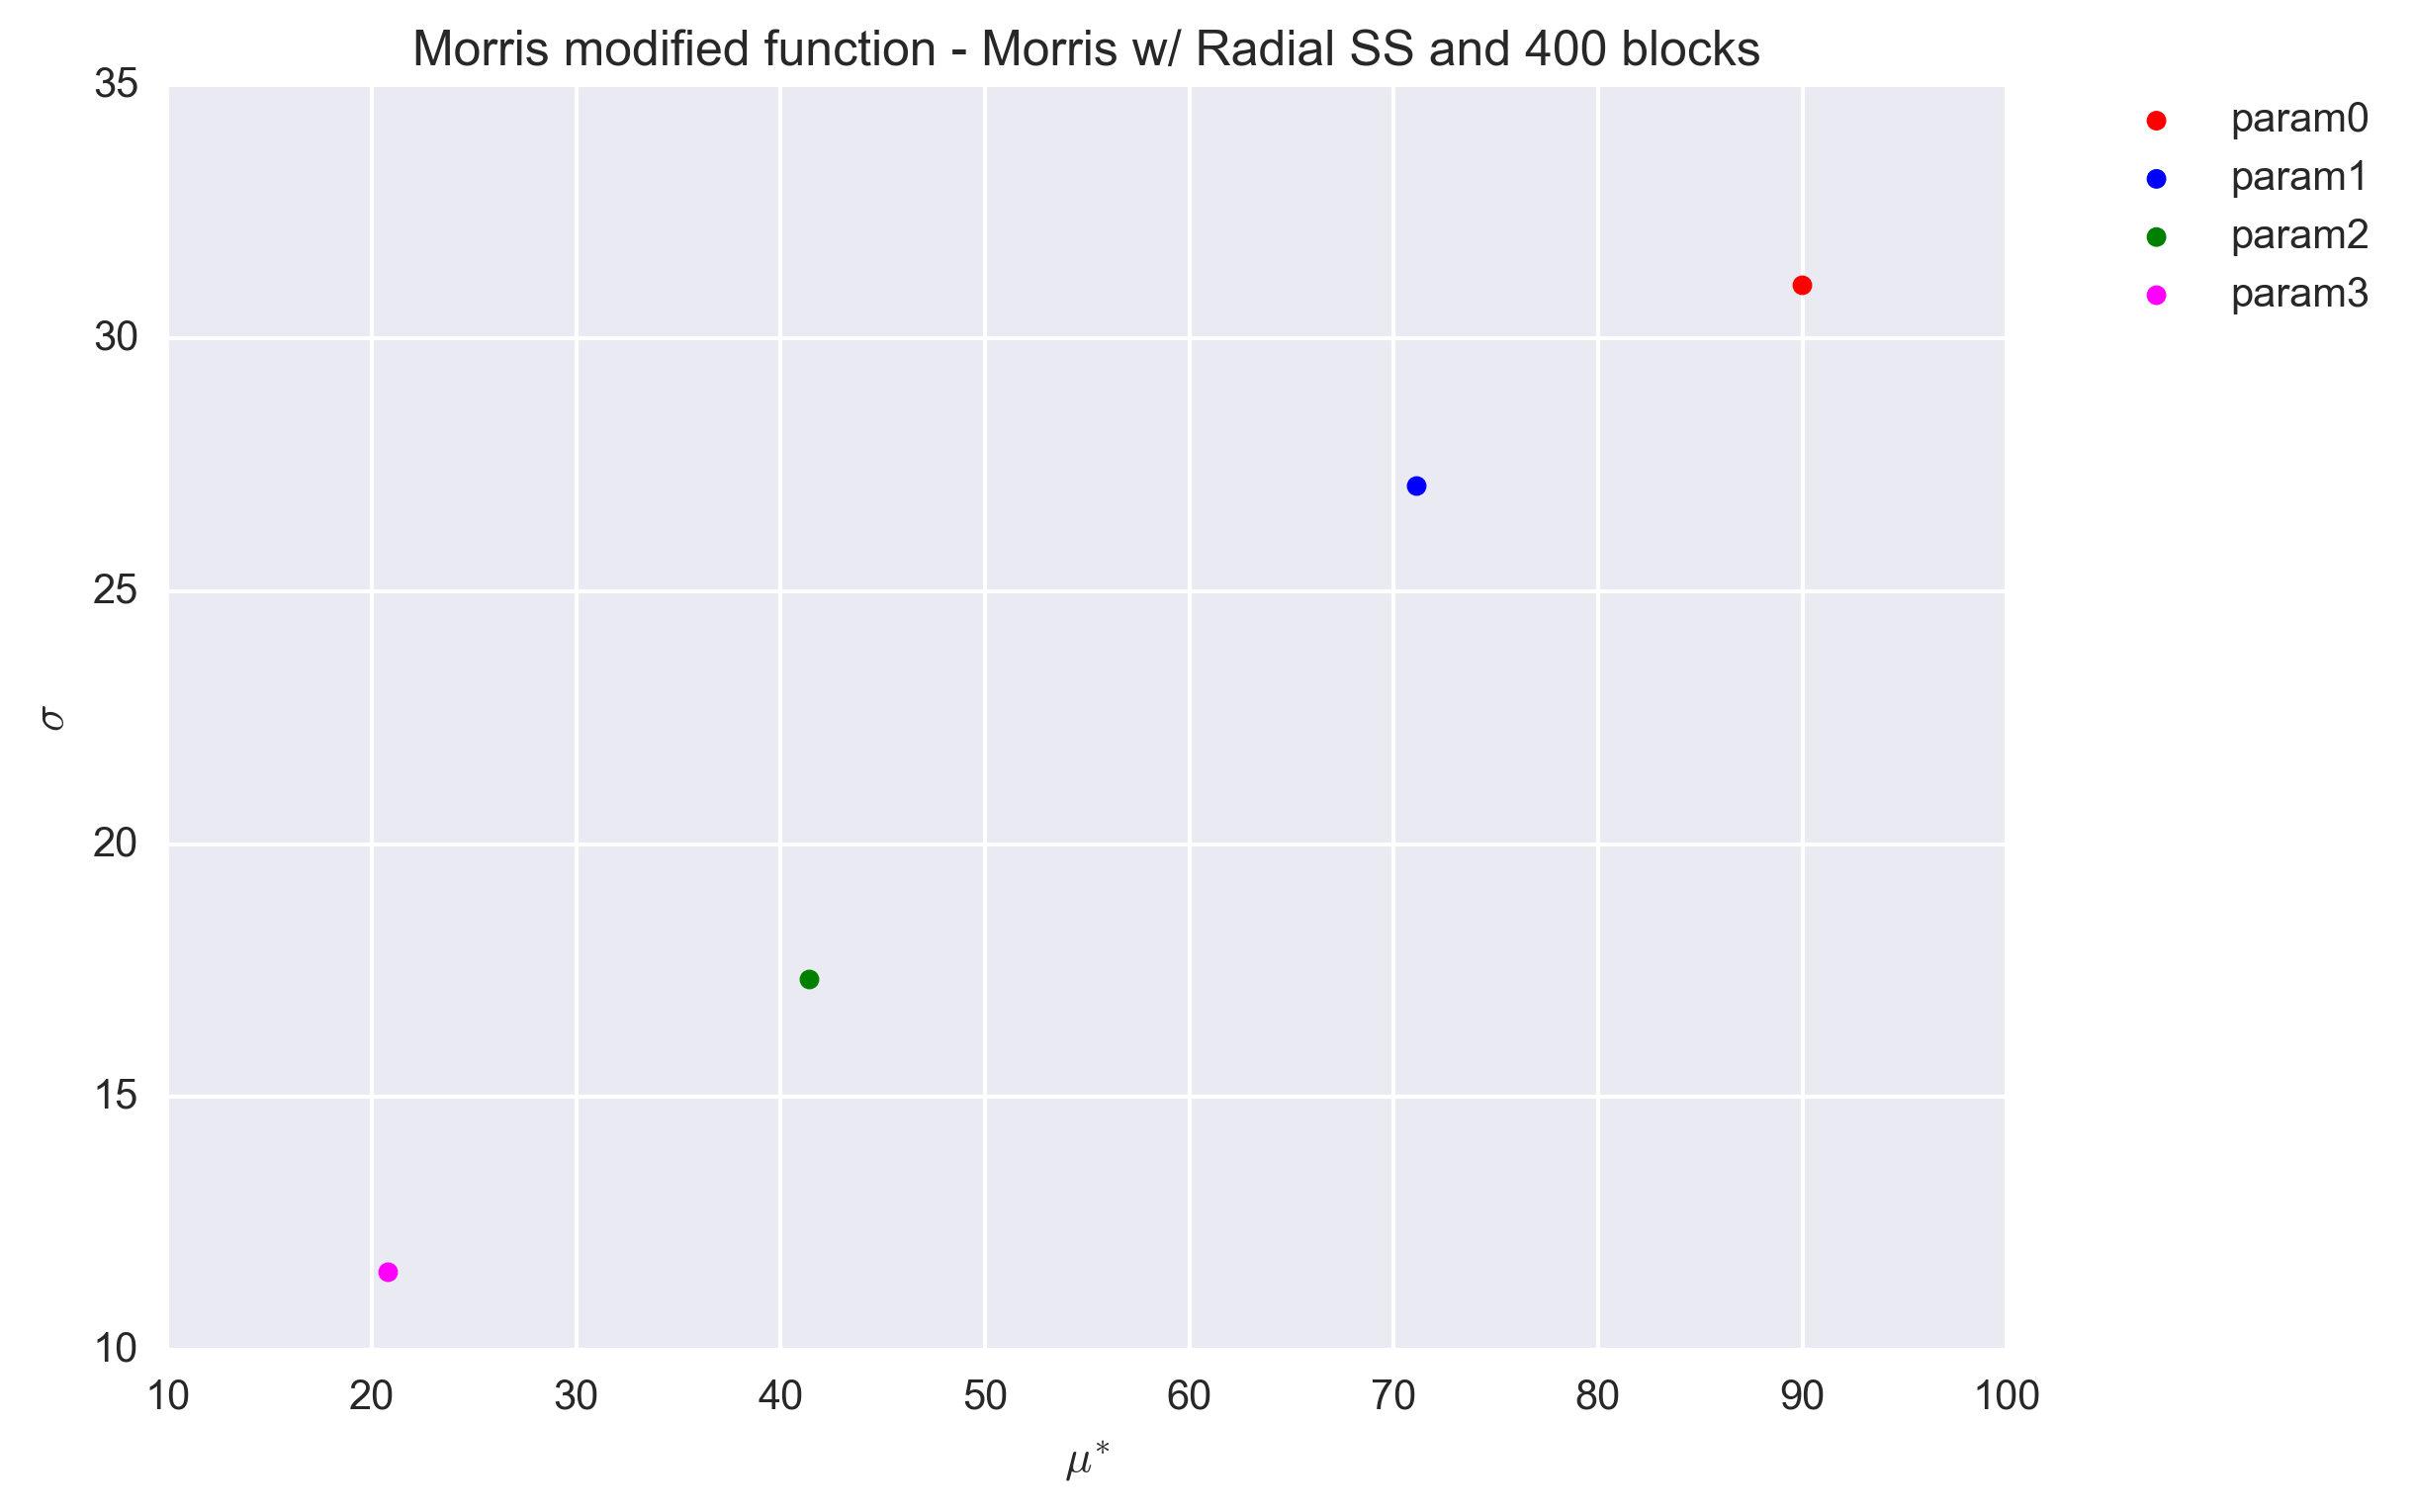
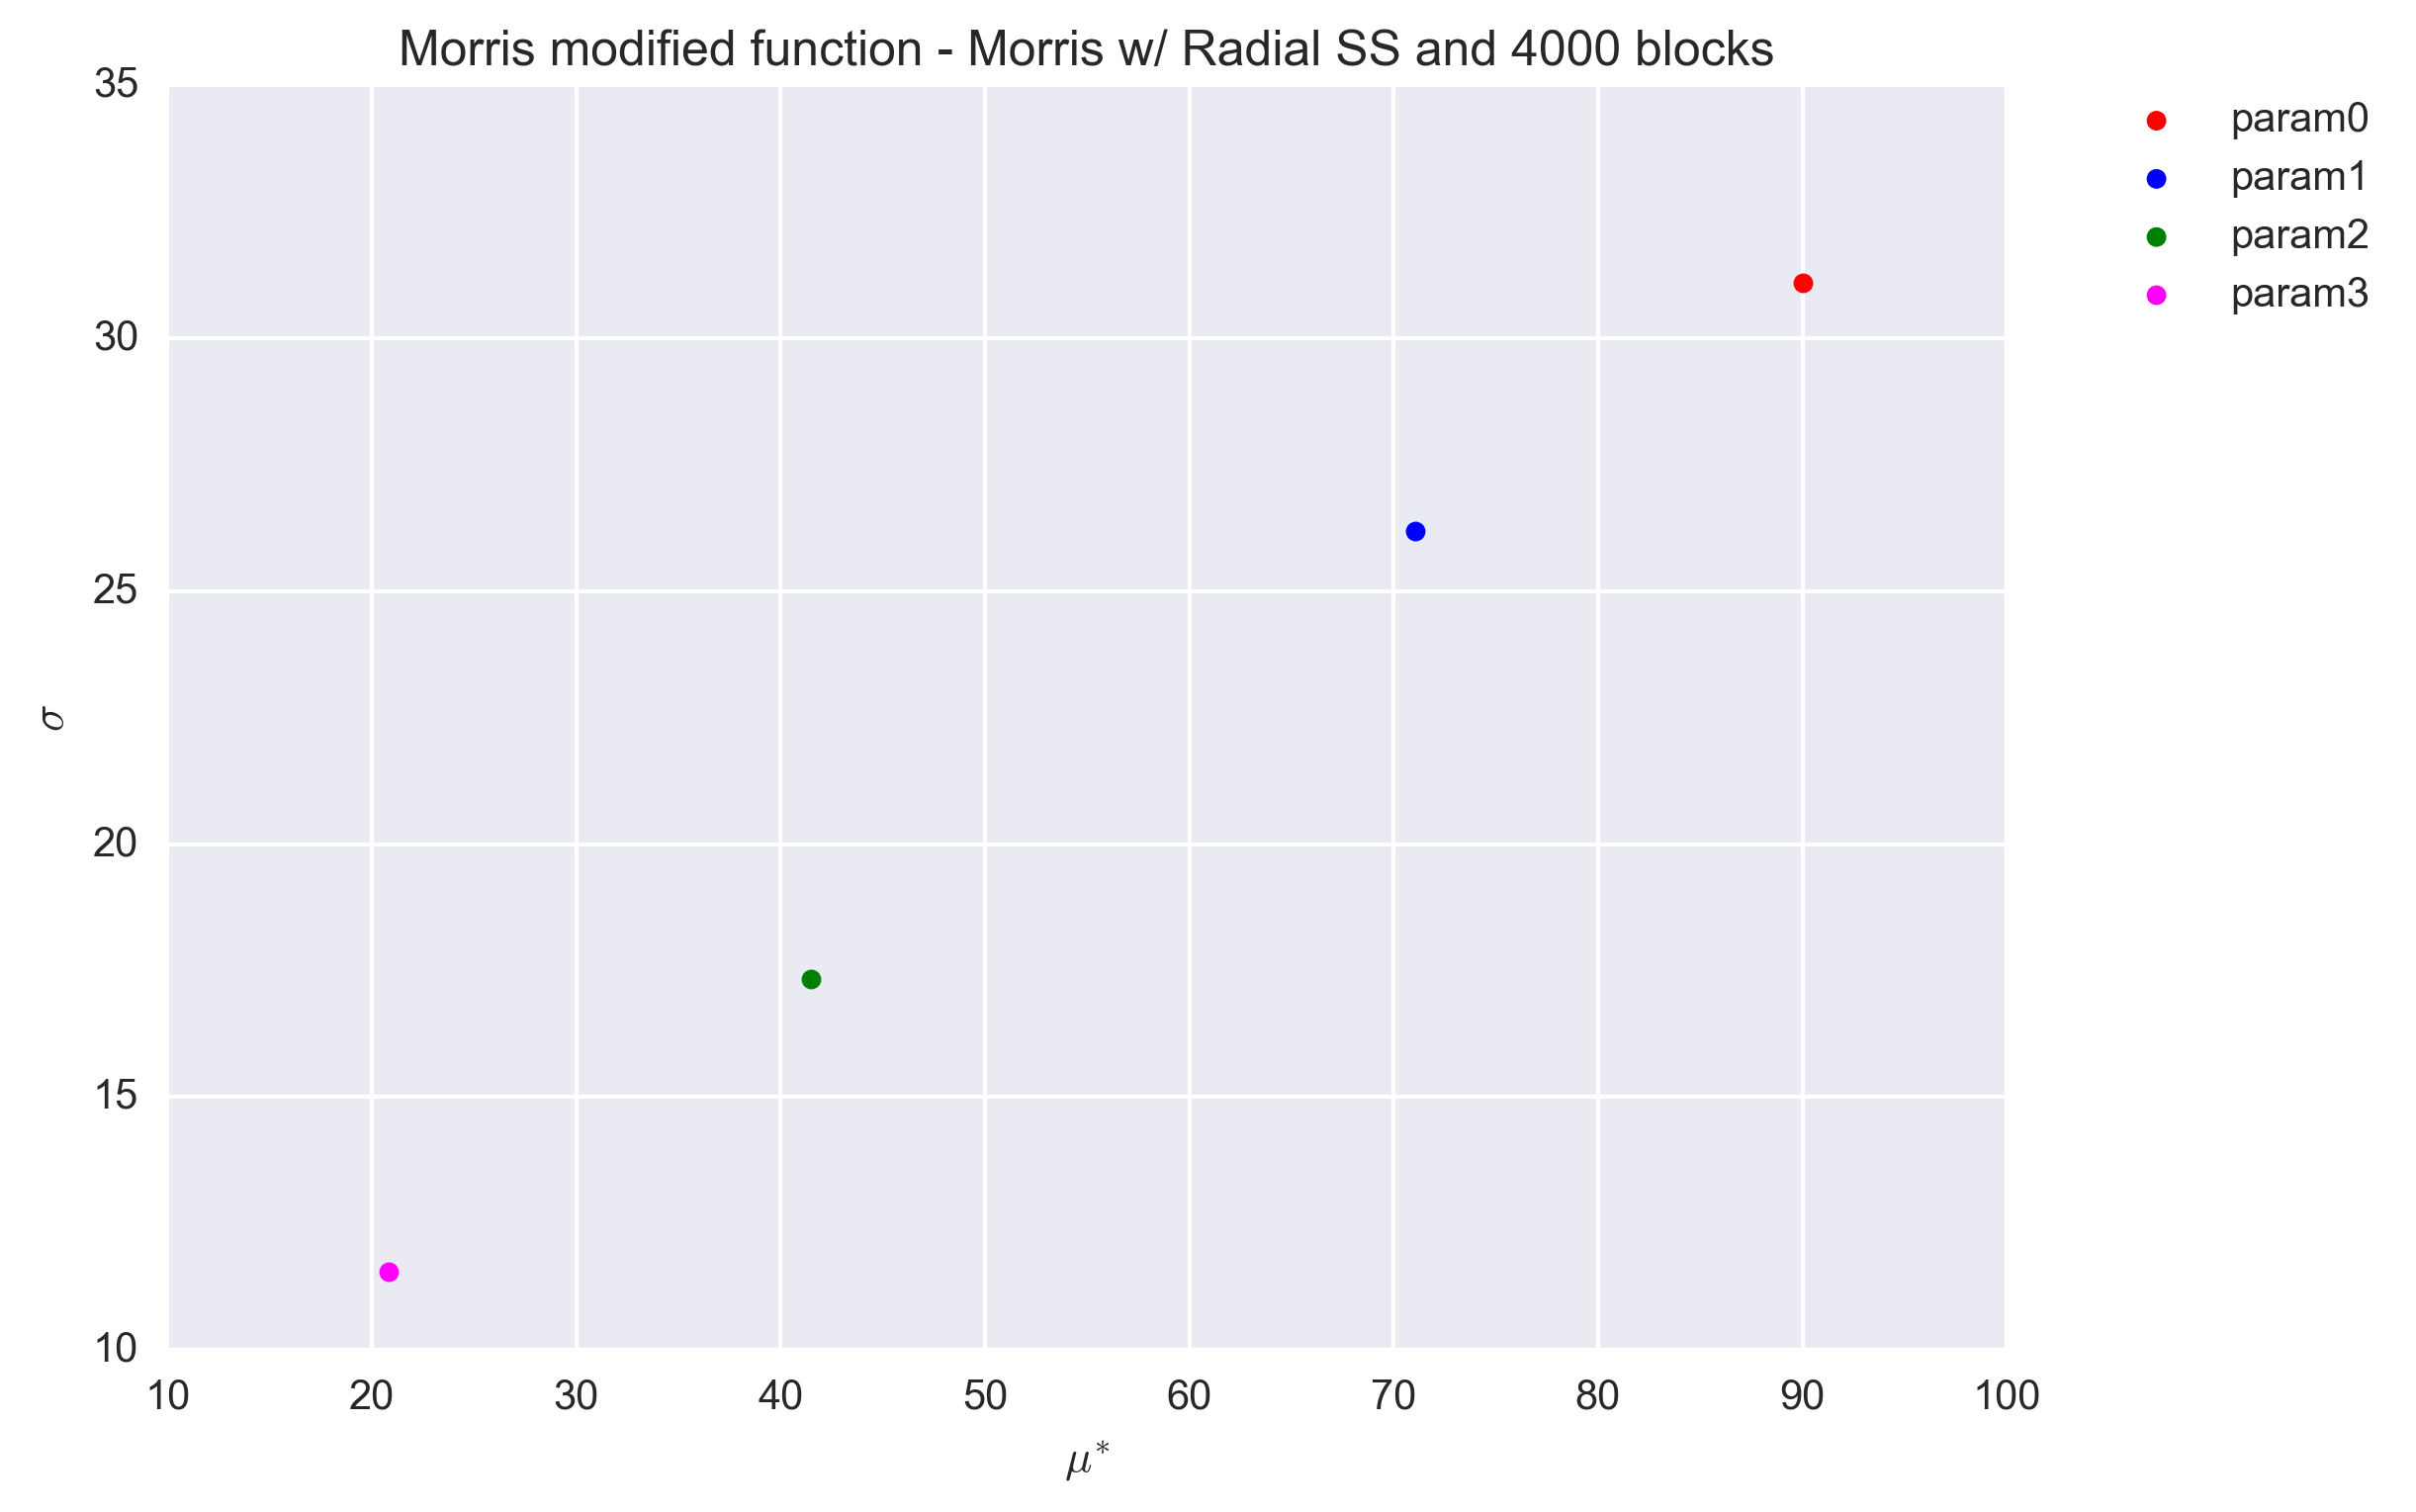
The values are found to be quite stable, even for a block value of r=40 and are in agreement with that obtained with the trajectory design (Section Trajectory sampling design). A better quanitification of the convergence to the reference values of \(\sigma\), \(\mu^*\) is shown in the table below. The only possible exception is for \(\sigma\) of parameter 1 (\(x_2\)).
| Parameter | Statistics | Ref | r=40 | r=400 | r=4000 |
|---|---|---|---|---|---|
| Param0 | \(\mu^*\) | 90.05 | 87.11 | 89.97 | 90.02 |
| Param0 | \(\sigma\) | 31.08 | 31.99 | 31.05 | 31.09 |
| Param1 | \(\mu^*\) | 71.05 | 69.36 | 71.11 | 71.06 |
| Param1 | \(\sigma\) | 28.86 | 24.10 | 27.09 | 26.18 |
| Param2 | \(\mu^*\) | 41.47 | 40.50 | 41.38 | 41.47 |
| Param2 | \(\sigma\) | 17.75 | 17.31 | 17.33 | 17.33 |
| Param3 | \(\mu^*\) | 20.83 | 20.19 | 20.76 | 20.82 |
| Param3 | \(\sigma\) | 11.54 | 11.53 | 11.55 | 11.55 |